-
Information Security
Multi-level Protection And Compliance
Web Applications And API Protection
-
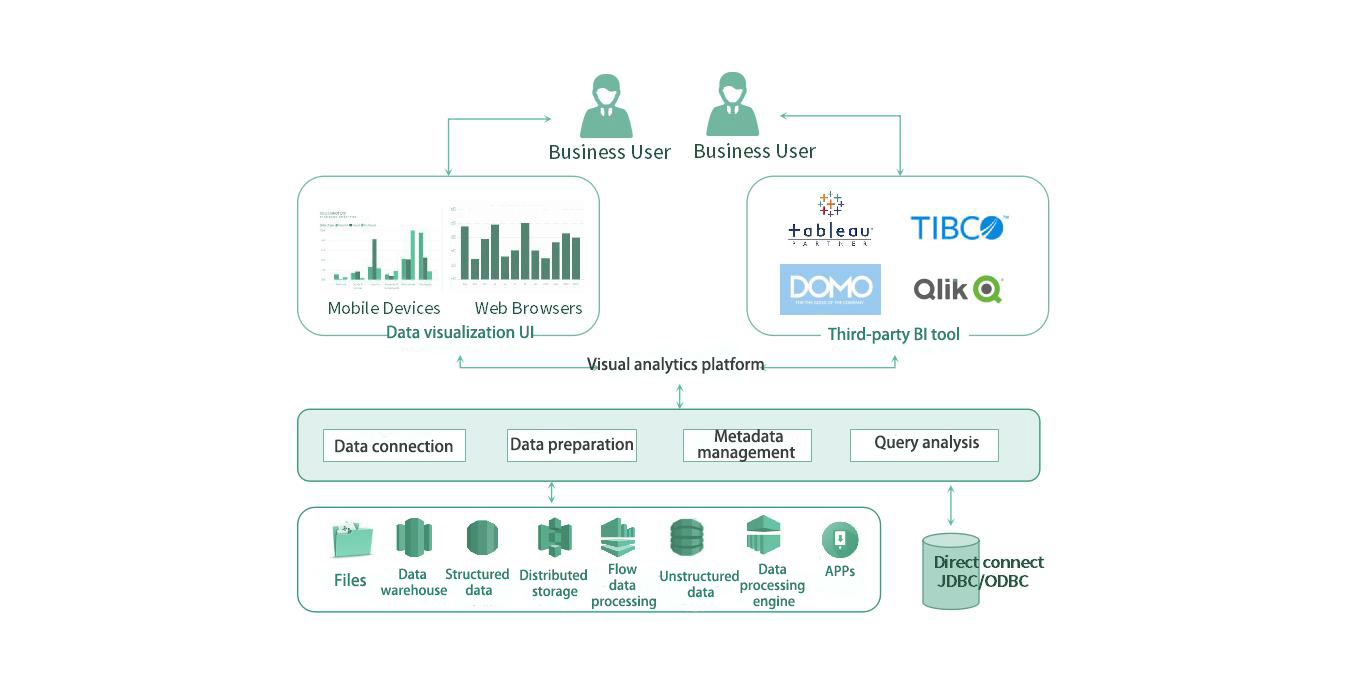
Data Intelligence
-
Intelligent Operation
-
Cloud Network Integration
-
Application Modernization
Business Active-Active Architecture
Building Cloud Native Applications
-
Collaboration
Attack-Defense Confrontation

ECCOM helps enterprises establish a full-fledged security protection framework, and provides services including asset sorting, vulnerability scanning, baseline verification, penetration testing, etc., to improve the level of enterprise security operations and reduce security risks.
MoreEccom ULink Cloud Video Platform

The next-generation intelligent fusion video platform helps governments and enterprises build open and intelligent cooperative communication capabilities.Through in-depth integration with business systems and business processes, it can perfectly adapt to the daily video conference scenarios of governments and enterprises and industry-specific application requirements.
MoreSmart Service
- Consulting
- Integration Implementation
- Support Maintenance
- Remote
- Operation Management
- Optimization
- Security Implementation
Service Solutions
- Data Center Full-Stack IT Architecture Integration
- Infrastructure Operations Insight Analysis and Optimization
- Business Migration To A Hybrid Cloud Environment
- IT Infrastructure O&M Services For Chinese Enterprises Going Global
- IT On-site Services For Multi-Branch Organizations
- Enterprise IPv6 Application Transformation Consulting And Implementation
MSS
Smart Cloud Services
- Managed Service
- Cloud Migration Service
- Cloud Consulting And Planning Services
- Lean Computing And Optimization Service For The Cloud
- Cloud-Native Application Development Services
Security Services
海外服务en
Managed Service

ECCOM provides Managed services & solutions specifically to address these challenges that businesses encounter when transitioning from a traditional infrastructure to a cloud-based one.
More-
Finance
Building Orchestratable Security Framework For Online Transactions
Low-Latency Trading Optimization Solution In Securities And Futures Markets
Network Construction Of Data Center Resource Pool
Backbone Network And Traffic Engineering
Full-stack IT For Urban Commercial Bank Data Centers
Building A BDR System For Data Center
-
Manufacture
Data Platform for Intelligent Manufacturing Line
Desktop Cloud Platform For Manufacturing Sector
Transportation
Big Data Analytics Of Smart Port Operations
Government
-
Education and Medicine
Big Data Management And Analytics Of Smart Campus
Smart Campus Network For Colleges And Universities
Enterprise
Intelligent Wireless Warehousing And Logistics
IPv6 Compliance

ECCOM has gained extensive project experience from in-depth participation in IPv6 transformation in state-owned banks, national commercial banks and other organizations. We have refined industry solutions to provide tailor-made IPv6 compliance transformation solutions for customers.
MoreAbout us
-
About us
-
News
Service
-
Smart Service
-
Service Solutions
Data Center Full-Stack IT Architecture Integration
Infrastructure Operations Insight Analysis and Optimization
Business Migration To A Hybrid Cloud Environment
IT Infrastructure O&M Services For Chinese Enterprises Going Global
IT On-site Services For Multi-Branch Organizations
Enterprise IPv6 Application Transformation Consulting And Implementation
-
MSS
-
Smart Cloud Services
-
Security Services
-
海外服务en
Industry
-
Finance
Building Orchestratable Security Framework For Online Transactions
Low-Latency Trading Optimization Solution In Securities And Futures Markets
Network Construction Of Data Center Resource Pool
Backbone Network And Traffic Engineering
Full-stack IT For Urban Commercial Bank Data Centers
Building A BDR System For Data Center
-
Manufacture
-
Transportation
-
Government
-
Education and Medicine
-
Enterprise